
Abstract
In a pre-registered randomized experiment, we found that, relative to a reverse chronological baseline, Twitter’s engagement-based ranking algorithm amplifies emotionally charged, out-group hostile content that users say makes them feel worse about their political out-group. Furthermore, we find that users do not prefer the political tweets selected by the algorithm, suggesting that the engagement-based algorithm underperforms in satisfying users’ stated preferences. Finally, we explore the implications of an alternative approach that ranks content based on users’ stated preferences and find a reduction in angry, partisan, and out-group hostile content but also a potential reinforcement of echo chambers. The evidence underscores the necessity for a more nuanced approach to content ranking that balances engagement, users’ stated preferences, and sociopolitical outcomes.
Click on the Download PDF button to the right to access the appendix.
Introduction
Social media ranking algorithms personalize content to individual user preferences. However, many hypothesize that these algorithms could inadvertently facilitate the propagation of angry content, stoke hostile discourse, and escalate polarization [1, 18, 26, 27]. Although numerous studies have delved into the effects of social media ranking algorithms, most are observational and have often yielded inconsistent findings [28]. The few randomized experiments [8, 15–17] that do exist have been primarily conducted by the companies that design these algorithms. While these in-house studies provide valuable insights, they are typically infeasible for external researchers to replicate. This accentuates the need for more randomized experimentation, especially from outside of the companies.
Moreover, while it is essential to know whether these algorithms are causing adverse outcomes, to design better alternatives, we must also understand why they do so. Even existing randomized experiments that isolate the effect of the ranking algorithm seldom delve into identifying which specific elements of the algorithm contribute to such outcomes. In this paper, we aim to dive deeper, not only examining if current algorithms are exacerbating divisiveness but also exploring the extent to which this is driven by their prioritization of engagement (users’ revealed preferences) over a more reflective notion of users’ preferences.
To do so, we conducted a randomized controlled experiment measuring the impacts of Twitter’s engagement-based ranking algorithm. Our study was pre-registered, required no collaboration with the platform, and our data and code is available at http://github.com/smilli/twitter will be available to the research community . Over two weeks in February 2023, we recruited a group of Twitter users (N=806) and collected the first 10 tweets that the personalized algorithm would have shown them and the first 10 tweets they would have seen under a reverse-chronological baseline. Using a within-subjects design, we showed users the tweets from both rankings in a randomized order and surveyed them about each one, allowing us to measure the causal impact of the engagement-based ranking on readers’ perceptions, relative to the reverse-chronological baseline.
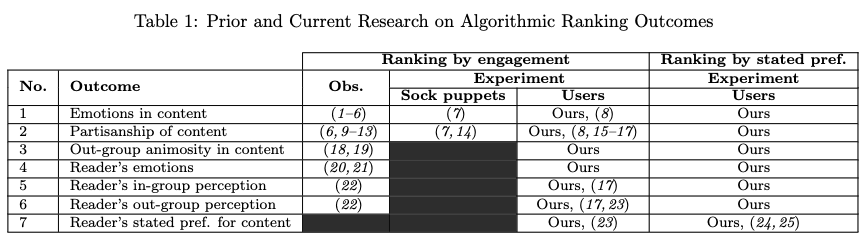
To investigate the role of the engagement-based algorithm in shaping discourse and attitudes, we studied its effect on six key outcomes (Outcomes 1-6 in Table 1) related to the curation of emotional and political content and the emotions and political perceptions of readers. In particular, we measured how the algorithm affected the emotions, partisanship, and out-group animosity expressed in the content shown, as well as the emotions experienced by the reader, and the reader’s perception of their political in-group and out-group. Throughout our paper, we refer to these six outcomes as “sociopolitical outcomes.” As summarized in Table 1, there is limited experimental evidence for many of these outcomes. Thus, our first line of inquiry can be summarized by the following research question:
Question 1. How does the engagement-based ranking algorithm impact the sociopolitical outcomes under consideration (Outcomes 1-6)?
Our second research question asked whether Twitter’s ranking algorithm, which optimizes primarily for engagement (users’ revealed preferences), also aligns with users’ explicitly stated preferences. Many hypothesize that an engagement-centric approach may inadvertently promote polarizing content by focusing on users’ immediate reactions rather than their reflective evaluations of the content [29–32]. Therefore, if this engagement-focused characteristic is a key factor in the amplification of divisiveness, it would be reasonable to expect that the algorithm might underperform in aligning with users’ stated preferences. However, we found almost no prior studies that provided evidence for how well ranking algorithms satisfied users’ stated preferences (Table 1), relative to simple baselines like a chronological or random feed.
Question 2. Does the engagement-based ranking algorithm show more content that users say they want to see (Outcome 7)?
Finally, in exploratory analysis, we measured the impact of ranking based on users’ explicitly stated preferences rather than the traditional engagement-based approach. Aligning with a more reflective notion of value—focusing on users’ stated preferences—could potentially counter the negative effects commonly associated with engagement-based algorithms [29–32]. However, it is crucial to verify these theoretical benefits as it could be that users still prefer content that is divisive or hostile, even after reflection [33]. We were unable to find any prior work measuring the effect of ranking by stated preferences on the sociopolitical outcomes we consider (Table 1). Thus, our last, exploratory inquiry aims to fill this gap and is summarized in the following question.
Question 3. What impact does ranking by users’ stated preferences have on the sociopolitical outcomes considered (Outcomes 1-6)?
1 Results
From February 11 to February 27, 2023, we conducted our experiment with active Twitter users from the United States. We used CloudResearch Connect, an online crowd-working platform, to recruit participants. The study period was divided into four waves, and participants were allowed to take part in the study once during each wave. In total, 806 unique users participated in our study a total of 1730 times. Each time a user participated in our study, we collected two sets of tweets for them: (a) the first 10 tweets they would have been shown by Twitter’s engagement-based algorithm and (b) the first 10 tweets they would have seen if they were shown the latest tweets from the people they follow.
Using a within-subjects design, we then surveyed users about tweets from both of their timelines in a randomized order, querying them about Outcomes 1-7 in Table 1. For each tweet, we asked the user to assess whether it was about a political or social issue. If they marked the tweet as political, we asked them about the tweet’s ideological leaning, their own perception of their political in-group and out-group after reading the tweet, and whether the tweet author was expressing animosity towards their out-group. For all tweets (including non-political tweets), we asked users to assess the author’s emotions as well as the emotions the tweet made them feel, along four dimensions: happiness, anger, sadness, and anxiety. Finally, we also asked the reader whether they wanted to see tweets like it when they used Twitter.
Note that, for our main analysis, we rely on the reader’s judgments even for outcomes that are about the tweet itself (the tweet’s ideological leaning, the emotions expressed by the author, and whether the tweet expresses out-group animosity). In SM section S4.6, we use GPT-4 [34], a large language model, to label these outcomes instead and find that all results are qualitatively the same.
A full description of our study procedure can be found in SM section S1. In SM section S4.1, we provide descriptive statistics of the metadata in both timelines, e.g., the number of likes, retweets, links, photos, etc in each tweet, as well as analysis on the amplification of individual user accounts.
1.1 Effects of engagement-based ranking
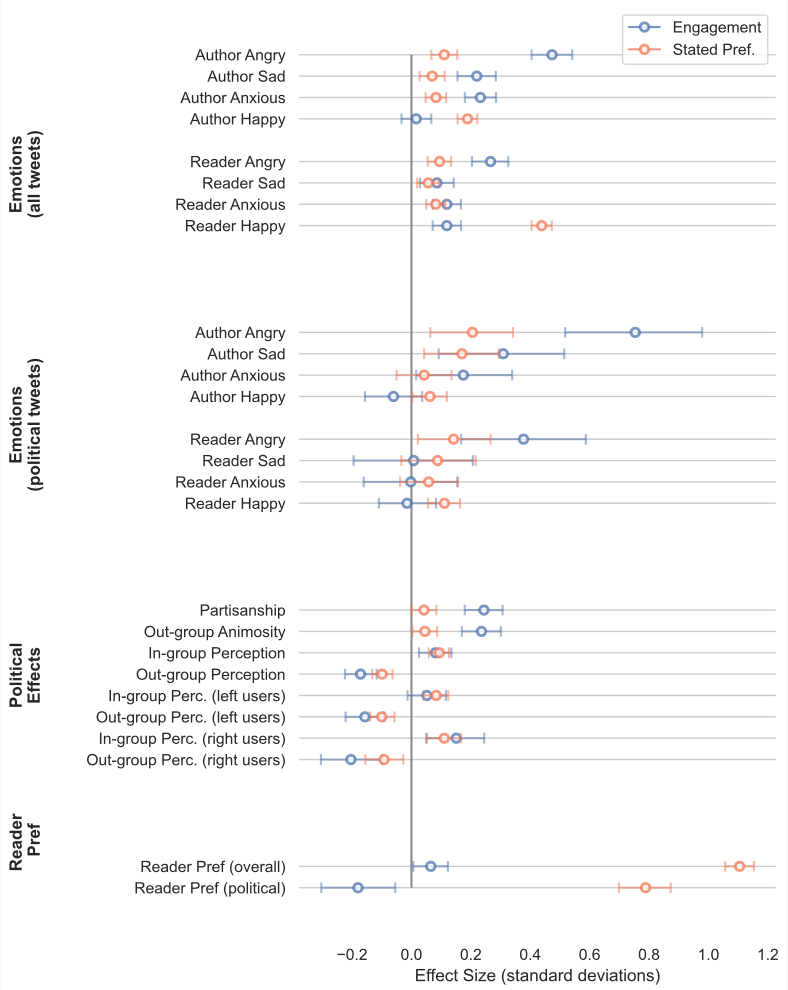
First, we state our findings on how Twitter’s engagement-based algorithm affects political outcomes, emotional outcomes, and the reader’s stated preference for the tweets shown. All tested outcomes and our analysis plan were pre-registered at https://osf.io/upw9a. Figure 1 shows a summary of the average treatment effect for each outcome. As specified in our pre-analysis plan, the average treatment effect is estimated through a difference in means (see SM section 1.3), and two-sided p-values are estimated by paired permutation tests. In total, we tested 26 outcomes, and all results that are significant (at a p-value threshold of 0.05) remain significant at a false discovery rate (FDR) of 0.01. Thus, in expectation, none of our discoveries are false discoveries. The full table of standardized and unstandardized effect sizes, p-values, and FDR-adjusted p-values can be found in SM section S3.
Political outcomes (Outcomes 2, 3, 5, and 6). We defined the partisanship of a tweet as the absolute value of the reader-provided ideological leaning of the tweet (ranging from -2 = “Far left” to +2 = “Far right”). Relative to the reverse-chronological baseline, we found that the engagement-based algorithm amplified tweets that exhibited greater partisanship (0.24 SD, p < 0.001) and expressed more out-group animosity (0.24 SD, p < 0.001). Furthermore, tweets from the engagement-based algorithm made users feel significantly worse about their political out-group ( ́0.17 SD, p < 0.001) and better about their in-group (0.08 SD, p = 0.0014). These effects remained significant when considering left and right-leaning users specifically, except for in-group perception in left-leaning users, where we found no significant effect.
Amplified emotionality (Outcomes 1 and 4). The algorithm significantly amplified tweets that expressed negative emotions—anger (0.47 SD, p < 0.001), sadness (0.22 SD, p < 0.001), and anxiety (0.23 SD, p < 0.001). It also leads readers to feel more of all four emotions—anger (0.27 SD, p < 0.001), sadness (0.09 SD, p = 0.003), anxiety (0.12 SD, p < 0.001), and happiness (0.12 SD, p < 0.001). When considering only political tweets, we found that anger was by far the predominant emotion amplified by the algorithm, both in terms of the emotions expressed by authors (0.75 SD, p < 0.001) and the emotions felt by readers (0.37 SD, p < 0.001).
User’s stated preference (Outcome 7). For each tweet, we also asked users whether they wanted to see tweets like it when they used Twitter. We found that overall, tweets shown by the algorithm are rated slightly higher (0.06 SD, p = 0.022). Interestingly, however, the political tweets recommended by the personalized algorithm lead to significantly lower user value than the political tweets in the chronological timeline ( ́0.18 SD, p < 0.005).
1.2 Ranking by stated preferences
Next, we conduct an exploratory analysis in which we simulate an alternative ranking of tweets that is based on users’ stated preferences. First, we take the approximately 20 unique tweets that each user was surveyed about and re-rank these tweets by the users’ stated preference for the tweet. Each tweet receives a score of 1 = “Yes,” 0 = “Indifferent,” or ́1 = “No,” depending on the users’ stated preference for the tweet. The “Stated Preference” (SP) timeline consists of the ten tweets (out of the approximately twenty unique tweets) that scored highest according to the users’ stated preferences (ties are broken at random).
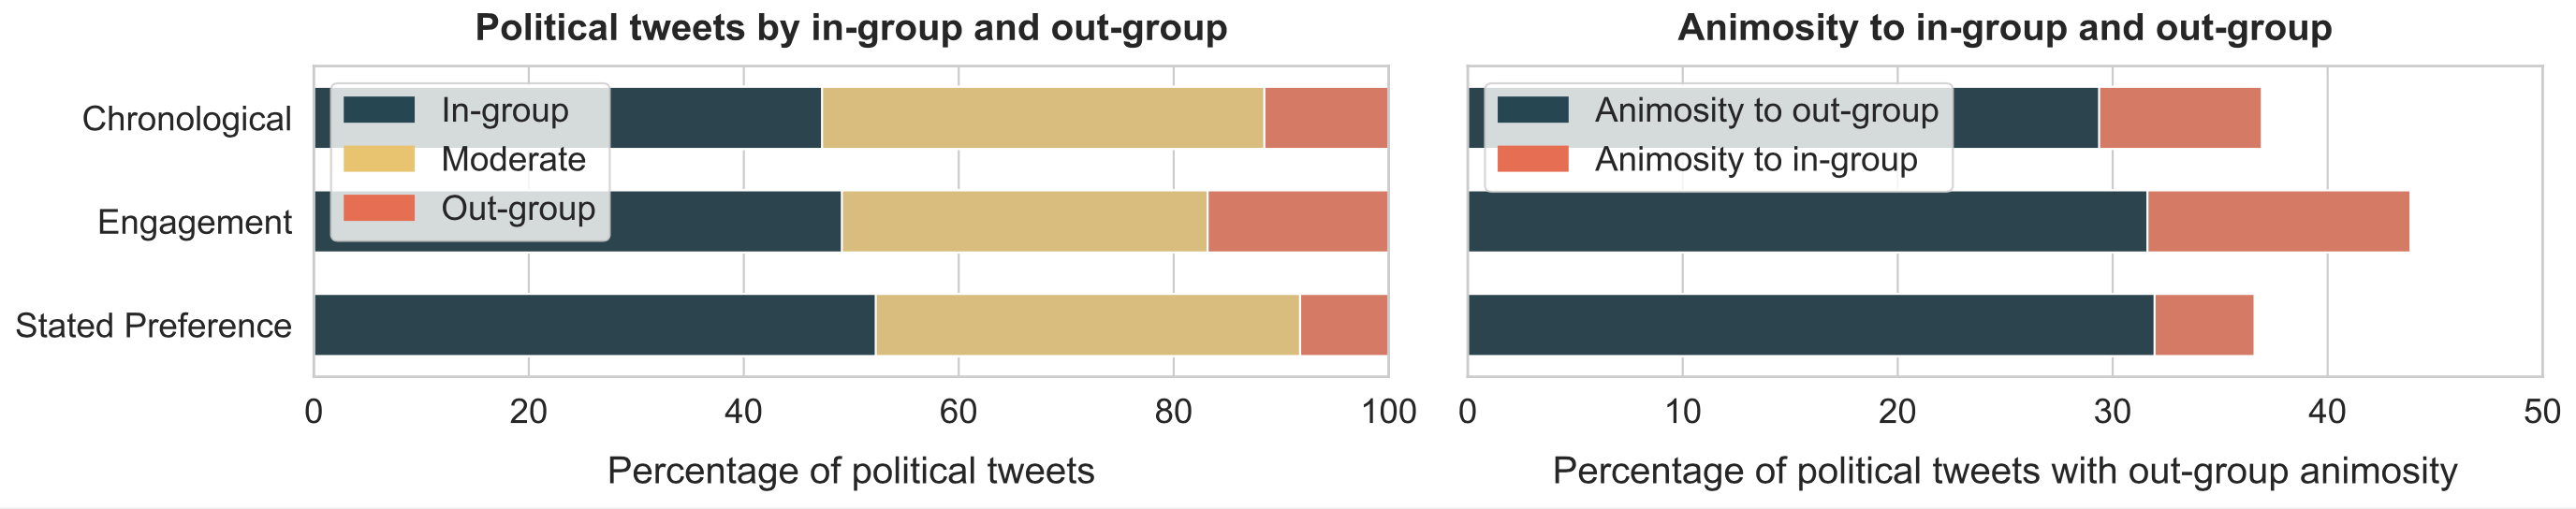
As shown in Figure 2, relative to the engagement timeline, the SP timeline reduces negativity (anger, sadness, anxiety) and increases happiness, both in terms of the emotions expressed by authors and the emotions felt by readers. Moreover, the content shown in the SP timeline is less partisan and less likely to contain expressions of out-group animosity. However, further analysis shown in Figure 2 reveals that the reduction in partisanship and animosity in the SP timeline is due almost entirely to reducing the number of tweets from the reader’s out-group, and by reducing the animosity directed toward the reader’s in-group (but not animosity towards the reader’s out-group).
2 Discussion
2.1 The effects of Twitter’s engagement-based algorithm
Amplification of emotions and out-group animosity. Our study reveals that the engagement- based algorithm tends to amplify emotionally charged content, particularly that which expresses anger and out-group animosity. The differences were sizable. Of the political tweets chosen by Twitter’s algorithm, 62 percent expressed anger and 46 percent contained out-group animosity. In comparison, of the political tweets in the chronological timeline, 52 percent expressed anger and 38 percent contained out-group animosity. This finding helps clarify inconsistencies in previous research. Earlier studies relied on observational methods that were limited to specific subsets of content on the platform [1, 18] and replications produced mixed results [2, 3]. Our randomized experiment provides insight into this debate by providing causal evidence that, indeed, the algorithm amplifies emotionally-charged content. In order to ensure greater external validity, we also examined the effect of the algorithm on tweets that users themselves would actually encounter on the platform in their own timelines.
Partisan tweets, but no filter bubble. Like prior observational and experimental work [6, 12, 15], we found that the content that the engagement-based algorithm amplified tended to be more partisan. However, we did not find evidence that the engagement-based algorithm contributed to a “filter bubble” [35]. On the chronological timeline, 48 percent of political tweets came from the users’ in-group, and 11 percent came from the users’ out-group. On the other hand, on the engagement-based timeline, 50 percent of sociopolitical tweets were in-group tweets and 16 percent were out-group tweets (see Figure 2). Thus, the algorithm actually showed users more content from their out-group, and this increase was larger than the corresponding increase in in-group content. This is partially consistent with Guess et al. (2023) who found that the Facebook news feed ranking algorithm increased the amount of in-group and out-group content [17]. However, they also found that the increase in in-group content was greater than the increase in out-group content—a reversal of our finding.
Amplification of polarizing content. We asked users how they felt about their political in-group and out-group (from “Much worse” to “Much better”) after each individual piece of content they saw from either the engagement-based or chronological timeline. We found that, after reading tweets selected by the engagement-based algorithm, users tended to have more positive perceptions of their in-group and more negative perceptions of their out-group, compared to the chronological baseline. Our results suggest that the engagement-based ranking algorithm is more polarizing than a chronological one.
Nevertheless, it is unclear whether ranking algorithms have lasting effects on users’ attitudes and affective polarization. In contrast to our content-specific surveying, Guess et al. (2023) measured the effect of the Facebook and Instagram ranking algorithms on users’ affective polarization, in general, between two weeks to three months after the start of their experiment [17]. They found no significant impact on users’ affective polarization. Crucially, however, the scope of Guess et al. (2023)’s research does not encompass “general equilibrium” effects, such as the possibility for ranking algorithms to indirectly shape user attitudes by incentivizing and changing the type of content that users produce in the first place.
Stated preference. We found that users had only a slight preference for tweets in their engagement-based timeline compared to tweets in their reverse chronological timeline. This small preference is notable because Twitter’s algorithm has a large effect on how much time users spend on the platform [36, 37]. Moreover, users were less likely to prefer the political tweets that the algorithms selected. This suggests that the engagement-based algorithm may be catering to users’ revealed preferences but not to their stated preferences, especially when it comes to political content.
2.2 Ranking by stated preferences
The engagement-based algorithm amplified divisive content and failed to meet users’ stated preferences. This observation led us to question: What are the implications of ranking content by users’ stated preferences instead?
The effects of ranking by stated preference. In exploratory analysis, we evaluated the effects of creating an alternative ranking based on users’ stated preference (SP). We found that the SP time- line significantly reduced the prevalence of angry content, partisan content, and content that expressed out-group animosity, relative to the engagement-based timeline. This suggests that part of the reason current algorithms amplify divisiveness is their prioritization of engagement over more reflective notions of preference.
However, delving deeper, we also found that the decrease in partisan tweets predominantly came from a reduction in out-group tweets. Furthermore, the drop in out-group animosity was primarily due to reducing hostility towards the readers’ in-group (but not towards their out-group). This suggests that while explicitly stated preferences might lower overall animosity, they could inadvertently heighten users’ exposure to content that reinforces their pre-existing beliefs. This is in line with prior research suggesting that users’ preference for pro-attitudinal content and sources may be a primary driver of echo chambers online [13, 16, 38].
An important caveat in interpreting our results is that we only had a pool of approximately 20 tweets—the top 10 in the users’ chronological and engagement timelines—to choose from when ranking by stated preferences. The platform has access to a much larger pool of tweets, and more research is needed to understand the impact of ranking by stated preferences in such a context. For example, users might be open to seeing respectful and civil content from their political out-group, but those tweets may not have been common in our limited pool of tweets—especially since about half were explicitly selected using engagement metrics.
Trade-offs between ranking approaches. Given the vast amount of content available for ranking that algorithms can choose from, relative to the amount of content that an individual user can view, we hypothesize that it may be possible to do well enough with respect to all three of these desiderata: to achieve high user engagement, satisfy users’ stated preferences, and avoid amplifying hostile and polarizing content. In SM section S4.9, we show that a slight preference to the stated preference timeline, one which involves tie-breaking content ranking based on the presence of out-group animosity, satisfies users’ stated preferences as much as the SP timeline, but greatly reduces the amplification of divisive content and avoids reinforcement of echo chambers. However, more research is needed to understand the trade-offs inherent between all three of these desiderata, especially with respect to engagement.
Finally, in terms of the practicalities of content ranking, it is important to note that we do not advocate for scrapping the use of engagement. Compared to user surveys, which are sparse and potentially costly to collect, engagement data is readily available to platforms and still provides some signal about what users value. Engagement will likely be an important part of any content ranking algorithm [39]. But there may be smarter ways to combine dense engagement signals with sparser survey data. For example, Milli et al. (2021) created a latent variable model that learned to interpret different engagement signals in a way that remained consistent with users’ stated preferences [40].
2.3 Limitations
Our study was designed to be carefully controlled. The only difference between the two conditions in our experiment was whether the content was ranked reverse chronologically or through the personalized algorithm. This allowed us to obtain precise estimates of the (local) effect of the algorithmic ranking. However, such an approach does not capture the algorithm’s long-term effects. For example, by incentivizing some types of content over others, the algorithm changes what type of content is produced in the first place, which, in turn, affects what is available in the chronological timeline. If users have learned to produce more of the content that the algorithm incentivizes [41], this implies that the algorithm’s long-term effects on the content-based outcomes we measure (emotions, partisanship, and out-group animosity in tweets) may be even greater. Nevertheless, rigorous experimentation needs to be done to establish how all the effects found in our study change over time in response to feedback loops [42].
Another concern pertains to the ecological validity of our study. We only surveyed participants about the first 10 tweets in each timeline, a method that might not perfectly mimic real-world Twitter usage where users can scroll past various tweets. Looking at the first 10 tweets might be a reasonable approximation though—Bouchaud et al. (2023) found that users viewed an average of 30 tweets in one session of using Twitter [8]. In SM section S4.5, we show that our results are robust to using a range of thresholds, spanning from the first five tweets to the first 10 tweets.
Finally, we required participants to install a Chrome extension and relied on an online crowd-working platform for participant recruitment. This may have impacted the types of participants we could attract. In particular, our population tended to be younger (53 percent of our study are aged 18-34 years old, compared to 45 percent in the ANES study) and more likely to affiliate with the Democratic Party (56 percent Democrat in our study versus 41 percent in the ANES study) (see SM section 2 for full demographic statistics). We report on heterogenous effects by different demographic groups in SM section S4.7, however, more research may be warranted before generalizing to the full Twitter population.
References
[1] W. J. Brady, J. A. Wills, J. T. Jost, J. A. Tucker, J. J. Van Bavel, Emotion shapes the diffusion of moralized content in social networks, Proceedings of the National Academy of Sciences 114, 7313–7318 (2017).
[2] J. W. Burton, N. Cruz, U. Hahn, Reconsidering evidence of moral contagion in online social networks, Nature Human Behaviour 5, 1629–1635 (2021).
[3] W. J. Brady, J. J. Van Bavel, Estimating the effect size of moral contagion in online networks: A pre-registered replication and meta-analysis [Preprint] (2021). https://doi.org/10.31219/osf.io/s4w2x.
[4] W. J. Brady, J. A. Wills, D. Burkart, J. T. Jost, J. J. Van Bavel, An ideological asymmetry in the diffusion of moralized content on social media among political leaders., Journal of Experimental Psychology: General 148, 1802 (2019).
[5] S. Vosoughi, D. Roy, S. Aral, The spread of true and false news online, Science 359, 1146–1151 (2018).
[6] A. Hasell, Shared Emotion: The Social Amplification of Partisan News on Twitter, Digital Journalism 9, 1085–1102 (2021).
[7] The Economist, Twitter’s algorithm does not seem to silence conservatives, https://www.economist.com/graphic-detail/2020/08/01/twitters-algorithm-does-not-seem-to-silence-conservatives (August 1, 2020). Accessed on December 21, 2023.
[8] P. Bouchaud, D. Chavalarias, M. Panahi, Crowdsourced audit of Twitter’s recommender systems, Scientific Reports 13, 16815 (2023).
[9] M. Garz, J. Sörensen, D. F. Stone, Partisan Selective Engagement: Evidence from Facebook, Journal of Economic Behavior & Organization 177, 91–108 (2020).
[10] F. Giglietto, A. Valeriani, N. Righetti, G. Marino, Diverging patterns of interaction around news on social media: insularity and partisanship during the 2018 Italian election campaign, Information, Communication & Society 22, 1610–1629 (2019).
[11] J. C. Medina Serrano, O. Papakyriakopoulos, S. Hegelich, Dancing to the Partisan Beat: A First Analysis of Political Communication on Tiktok, Proceedings of the 12th ACM Conference on Web Science (2020), pp. 257–266.
[12] J. Maitra, R. Hänggli, Who speaks and who is heard on Facebook? Political mobilization and engagement patterns of partisanship and gender in Switzerland’s direct democracy, Journal of Quantitative Description: Digital Media 3 (2023).
[13] M. Wojcieszak, A. Casas, X. Yu, J. Nagler, J. A. Tucker, Most users do not follow political elites on Twitter; those who do show overwhelming preferences for ideological congruity, Science Advances 8, eabn9418 (2022).
[14] J. Bandy, N. Diakopoulos, More Accounts, Fewer Links: How Algorithmic Curation Impacts Media Exposure in Twitter Timelines, Proceedings of the ACM on Human-Computer Interaction 5, 1–28 (2021).
[15] F. Huszár, S. I. Ktena, C. O’Brien, L. Belli, A. Schlaikjer, M. Hardt, Algorithmic amplification of politics on Twitter, Proceedings of the National Academy of Sciences 119, e2025334119 (2022).
[16] E. Bakshy, S. Messing, L. A. Adamic, Exposure to ideologically diverse news and opinion on Facebook, Science 348, 1130–1132 (2015).
[17] A. M. Guess, N. Malhotra, J. Pan, P. Barberá, H. Allcott, T. Brown, A. Crespo-Tenorio, D. Dimmery, D. Freelon, M. Gentzkow, et al., How do social media feed algorithms affect attitudes and behavior in an election campaign?, Science 381, 398–404 (2023).
[18] S. Rathje, J. J. Van Bavel, S. Van Der Linden, Out-group animosity drives engagement on social media, Proceedings of the National Academy of Sciences 118, e2024292118 (2021).
[19] X. Yu, M. Wojcieszak, A. Casas, Partisanship on Social Media: In-Party Love Among American Politicians, Greater Engagement with Out-Party Hate Among Ordinary Users, Political Behavior pp. 1–26 (2023).
[20] L. Doroshenko, F. Tu, Like, Share, Comment, and Repeat: Far-right messages, Emotions, and Amplification in Social Media, Journal of Information Technology & Politics 20, 286–302 (2023).
[21] J. Berger, Arousal Increases Social Transmission of Information, Psychological science 22, 891–893 (2011).
[22] J. B. Walther, Z. Lew, A. L. Edwards, J. Quick, The effect of social approval on perceptions following social media message sharing applied to fake news, Journal of Communication 72, 661–674 (2022).
[23] C. Jia, M. S. Lam, M. C. Mai, J. Hancock, M. S. Bernstein, Embedding Democratic Values into Social Media AIs via Societal Objective Functions, arXiv:2307.13912 (2023).
[24] P. Khambatta, S. Mariadassou, J. Morris, S. C. Wheeler, Tailoring recommendation algorithms to ideal preferences makes users better off, Scientific Reports 13, 9325 (2023).
[25] L. Yang, M. Sobolev, Y. Wang, J. Chen, D. Dunne, C. Tsangouri, N. Dell, M. Naaman, D. Estrin, How Intention Informed Recommendations Modulate Choices: A Field Study of Spoken Word Content, The World Wide Web Conference (2019), pp. 2169–2180.
[26] R. Levy, Social Media, News Consumption, and Polarization: Evidence from a Field Experiment, American Economic Review 111, 831–870 (2021).
[27] J. J. Van Bavel, S. Rathje, E. Harris, C. Robertson, A. Sternisko, How social media shapes polarization, Trends in Cognitive Sciences 25, 913–916 (2021).
[28] J. Haidt, C. Bail, Social Media and Political Dysfunction: A Collaborative Review, https://tinyurl.com/PoliticalDysfunctionReview (August 28, 2023). Accessed on December 21, 2023.
[29] M. D. Ekstrand, M. C. Willemsen, Behaviorism is Not Enough: Better Recommendations through Listening to Users, Proceedings of the 10th ACM Conference on Recommender Systems (2016), pp. 221–224.
[30] J. Stray, A. Halevy, P. Assar, D. Hadfield-Menell, C. Boutilier, A. Ashar, L. Beattie, M. Ekstrand, C. Leibowicz, C. M. Sehat, et al., Building Human Values into Recommender Systems: An Interdisciplinary Synthesis, arXiv:2207.10192 (2022).
[31] J. Stray, R. Iyer, H. P. Larrauri, The Algorithmic Management of Polarization and Violence on Social Media, https://knightcolumbia.org/content/the-algorithmic-management-of-polarization-and-violence-on-social-media (August 22, 2023). Accessed on December 21, 2023.
[32] J. Kleinberg, S. Mullainathan, M. Raghavan, The Challenge of Understanding What Users Want: Inconsistent Preferences and Engagement Optimization, Proceedings of the 23rd ACM Conference on Economics and Computation (2022), pp. 29–29.
[33] T. Cunningham, Ranking by engagement, https://tecunningham.github.io/posts/2023-04-28-ranking-by-engagement.html (May 8, 2023). Accessed on December 21, 2023.
[34] OpenAI, GPT-4 Technical Report, arXiv:2303.08774 (2023).
[35] E. Pariser, The Filter Bubble: How The New Personalized Web is Changing What We Read and How We Think (Penguin, 2011).
[36] S. Milli, L. Belli, M. Hardt, Causal Inference Struggles with Agency on Online Platforms, Proceedings of the 2022 ACM Conference on Fairness, Accountability, and Transparency (2022), pp. 357–365.
[37] J. Bandy, T. Lazovich, Exposure to Marginally Abusive Content on Twitter, Proceedings of the International AAAI Conference on Web and Social Media (2023), vol. 17, pp.24–33.
[38] S. González-Bailón, D. Lazer, P. Barberá, M. Zhang, H. Allcott, T. Brown, A. Crespo-Tenorio, D. Freelon, M. Gentzkow, A. M. Guess, et al., Asymmetric ideological segregation in exposure to political news on Facebook, Science 381, 392–398 (2023).
[39] P. Bengani, J. Stray, L. Thorburn, What’s right and what’s wrong with optimizing for engagement, https://medium.com/understanding-recommenders/whats-right-and-what-s-wrong-with-optimizing-for-engagement-5abaac021851 (April 27, 2022). Accessed on December 21, 2023.
[40] S. Milli, L. Belli, M. Hardt, From Optimizing Engagement to Measuring Value, Proceedings of the 2021 ACM Conference on Fairness, Accountability, and Transparency (2021), pp. 714–722.
[41] W. J. Brady, J. C. Jackson, B. Lindström, M. Crockett, Algorithm-mediated social learning in online social networks [Preprint] (2023). https://doi.org/10.31219/osf.io/yw5ah.
[42] L. Thorburn, J. Stray, P. Bengani, From “Filter Bubbles”, “Echo Chambers”, and “Rabbit Holes” to “Feedback Loops”, https://techpolicy.press/from-filter-bubbles-echo-chambers-and-rabbit-holes-to-feedback-loops/ (April 17, 2023). Accessed on December 21, 2023.
[43] American National Election Studies, ANES 2020 Time Series Study Full Release, www.electionstudies.org (2021). Accessed on December 21, 2023.
[44] Y. Benjamini, A. M. Krieger, D. Yekutieli, Adaptive linear step-up procedures that control the false discovery rate, Biometrika 93, 491–507 (2006).
[45] M. L. Anderson, Multiple Inference and Gender Differences in the Effects of Early Intervention: A Reevaluation of the Abecedarian, Perry Preschool, and Early Training Projects, Journal of the American Statistical Association 103, 1481–1495 (2008).
[46] A. Ovadya, Can Algorithmic Recommendation Systems Be Good For Democracy? (Yes! & Chronological Feeds May Be Bad), https://www.belfercenter.org/publication/can-algorithmic-recommendation-systems-be-good-democracy-yes-chronological-feeds-may-be (February 4, 2022). Accessed on December 21, 2023.
[47] Z. Schiffer, C. Newton, Yes, Elon Musk created a special system for showing you all his tweets first, https://www.platformer.news/p/yes-elon-musk-created-a-special-system (February 14, 2023). Accessed on December 21, 2023.
[48] @elonmusk, Your article is false and obviously so. Do you really do no research at all? I mean, like reading a few tweets, for example., https://twitter.com/elonmusk/status/1626556852816470024 (2023). Tweeted on February 17, 2023, 4:19 AM [PT]. Accessed on September 8, 2023.
Acknowledgments
This study was financially supported by the UC Berkeley Center for Human-Compatible AI. Micah Carroll was supported by the National Science Foundation Graduate Research Fellowship Program. We thank Katy Glenn Bass, Fabian Baumann, William Brady, Molly Crockett, Tom Cunningham, Ravi Iyer, Philipp Lorenz-Spreen, Solomon Messing, Aviv Ovadya, Sara Johansen, Arvind Narayanan, Jonathan Stray, Luke Thorburn, and Nina Vasan for their discussion and feedback.
© 2024, Smitha Milli, Micah Carroll, Yike Wang, Sashrika Pandey, Sebastian Zhao and Anca Dragan.
Cite as: Smitha Milli, Micah Carroll, Yike Wang, Sashrika Pandey, Sebastian Zhao and Anca Dragan, Engagement, User Satisfaction, and the Amplification of Divisive Content on Social Media, 24-01 Knight First Amend. Inst. (Jan. 3, 2024), https://knightcolumbia.org/content/engagement-user-satisfaction-and-the-amplification-of-divisive-content-on-social-media [https://perma.cc/YUB7-4HMY].
Twitter rebranded to “X” in July 2023. Our study took place before the rebranding, so we refer to the platform as “Twitter.”
Jia et al. (2023) [23] was an exception. However, they did not evaluate a real-world recommender system’s impact on user satisfaction, like the Twitter or Facebook algorithm, but rather their own custom non-personalized ranking of Facebook posts based on public reaction counts.
If a tweet was a quote tweet or a reply to another tweet, then we surveyed the users about both the quote/quoted tweet and the reply/replied tweet. If a tweet was common to both the engagement-based and chronological timeline, we only surveyed the user about it once.
If a tweet was a quote tweet or a reply to another tweet, then we consider the two tweets to be one combined “tweet object” for the purposes of ranking and score them as the average of the users’ stated preferences for both tweets.
Smitha Milli is a postdoctoral associate at Cornell Tech.
Micah Carroll is a fourth-year PhD student studying artificial intelligence at UC Berkeley.
Yike Wang is a fifth-year MS student at UC Berkeley.
Sashrika Pandey is an MS in Computer Science candidate at UC Berkeley.
Sebastian Zhao is an undergraduate studying computer science and data science at UC Berkeley.
Anca Dragan is the Director of AI Safety and Alignment at Google DeepMind.